How to measure and improve TTFB in WordPress

Time to First Byte (TTFB) measures the delay between starting a page navigation and receiving the first byte of a response. It helps you investigate slow initial responses in WordPress, but it is not a measure of total page load time or hosting quality on its own.
A useful review separates network delays, caching behavior and the work WordPress performs to generate a page. This article explains how to measure those delays and choose improvements based on what you find.
Tabla de contenidos
What is TTFB?
Navigation TTFB can include redirects, DNS lookup, connection setup, TLS negotiation and waiting for the response. A high value may come from the network, the server or both. Check the definition used by your measurement tool before comparing results.
Google’s TTFB documentation describes these stages. It also explains why features such as Early Hints can affect what a tool records as the first response.
What is a good TTFB?
Google’s rough guidance is 0.8 seconds or less. Values above 0.8 seconds and up to 1.8 seconds need improvement; values above 1.8 seconds are poor. Assess the 75th percentile of real-user experiences where data is available rather than treating one local test as representative of every visitor.
A response of 10–200 milliseconds can be an excellent result in favorable conditions, but it is not a universal requirement. Compare similar pages, visitor locations and cache states, and consider whether the initial response is delaying meaningful content.
How TTFB affects user experience and SEO
A slow initial response can delay the content that follows, including the Largest Contentful Paint element. However, TTFB is not itself a Core Web Vital, and improving it does not guarantee better search rankings. Assess it alongside LCP, INP and CLS in WordPress to understand the wider user experience.
Low TTFB also does not guarantee a fast page. Heavy images, blocking resources or expensive browser-side work can still make a quickly delivered page slow to display or use. Google’s TTFB optimization recommendations explain how to interpret the metric in context.
What can increase TTFB in WordPress?
- Network distance and connection setup. Visitor location, DNS, redirects and connection reuse affect the time before a response arrives.
- Server workload. Resource contention and request queues can delay a response before WordPress finishes generating it.
- Application work. Slow database queries, external API calls and expensive plugin or theme logic can increase page generation time.
- Cache misses. A page that must be generated dynamically may respond differently from a cached copy.
A specific storage type, server brand or protocol does not guarantee a low TTFB. Compression can reduce transfer size, but it is not a general solution for slow initial response times. Diagnose the delay before choosing a technology or changing hosting.
How to measure TTFB in Chrome
1. Open DevTools and reload the page
Open Chrome DevTools with Ctrl + Shift + I on Windows or Command + Option + I on macOS. Select Network, then reload the page so the panel records the requests. Use the document request for the page you are testing, rather than assuming that the first listed item is always the right one.
2. Inspect the document request
Select the main HTML document and open Timing. Chrome’s Waiting for server response phase includes a network round trip and the time the server takes to prepare its response. DNS and connection setup are shown separately, so this phase is not identical to the full navigation TTFB reported by every other tool.
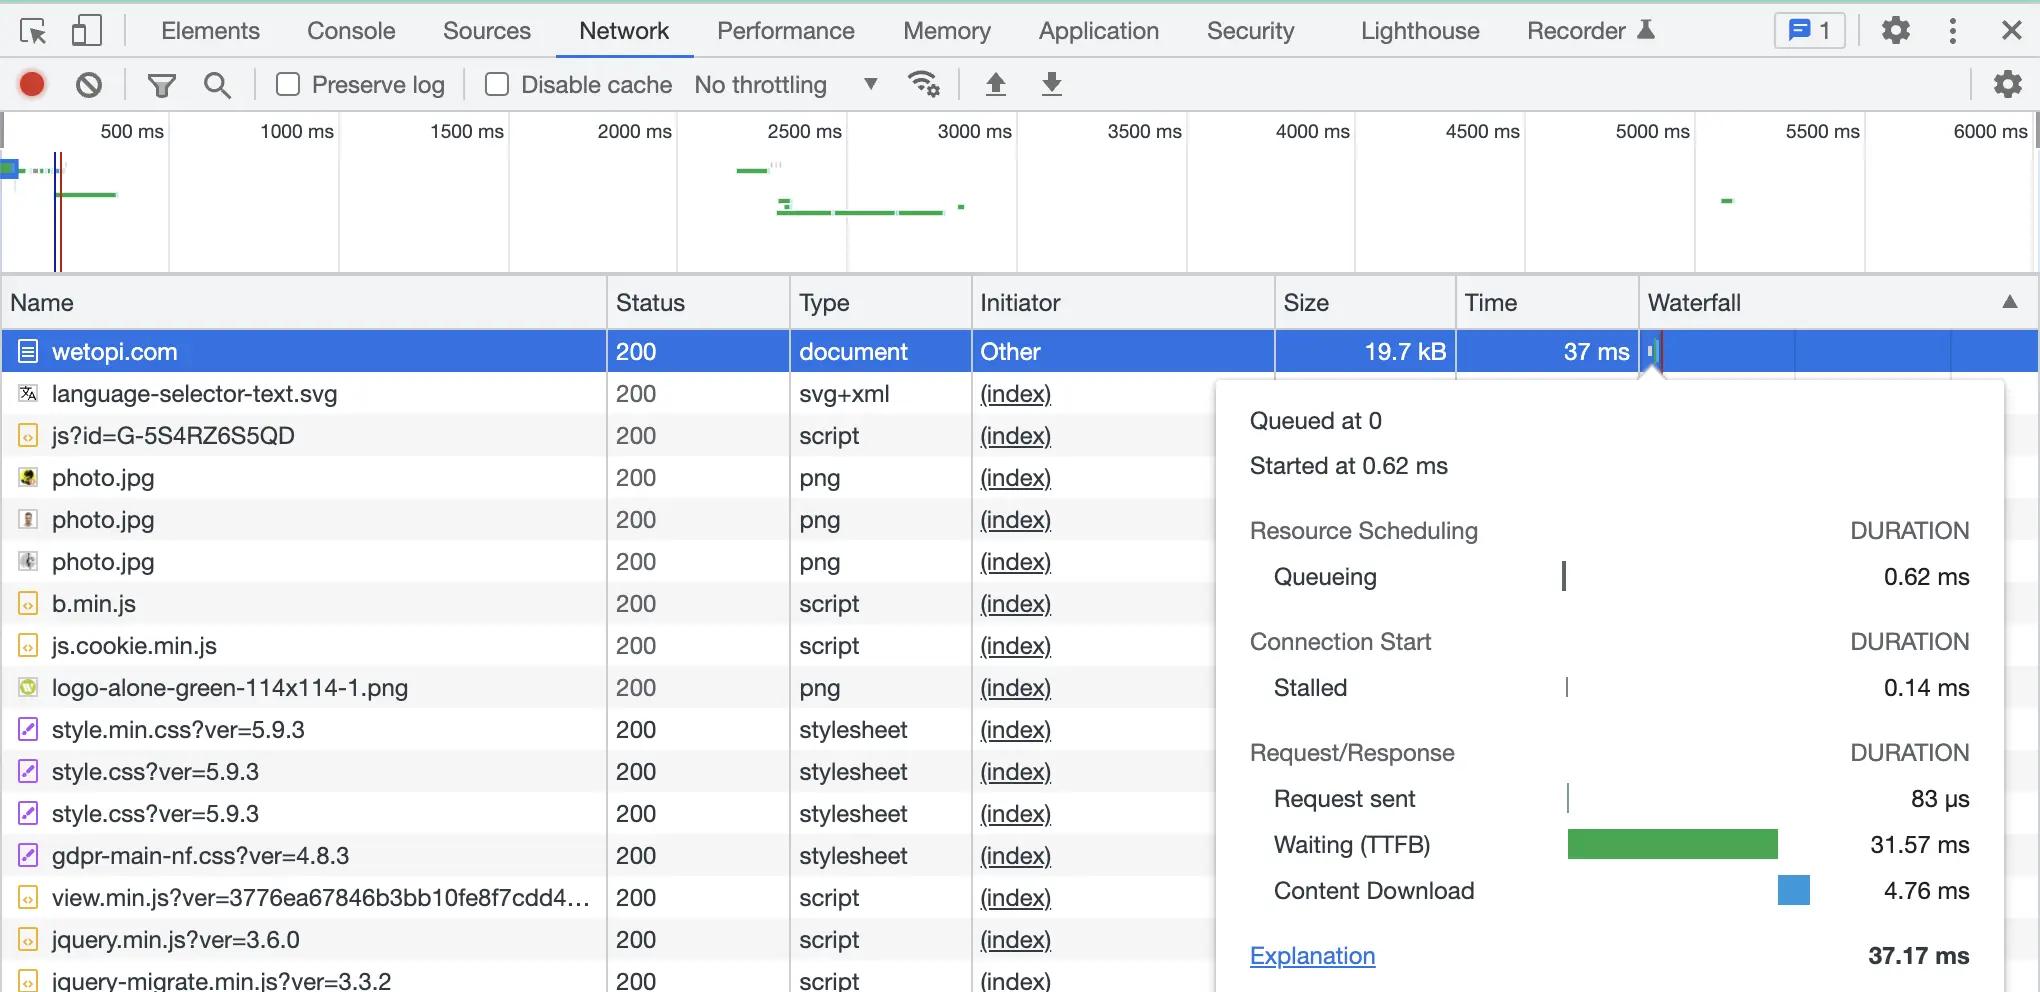
Consult the Chrome Network panel reference for the timing breakdown. Repeat the test and record the URL, location, login status and cache state.
3. Test the WordPress dashboard separately
Dashboard pages normally bypass public full-page caching because they contain personalized information. They may still benefit from object caching and PHP opcode caching, so their response time is not a pure hardware benchmark.
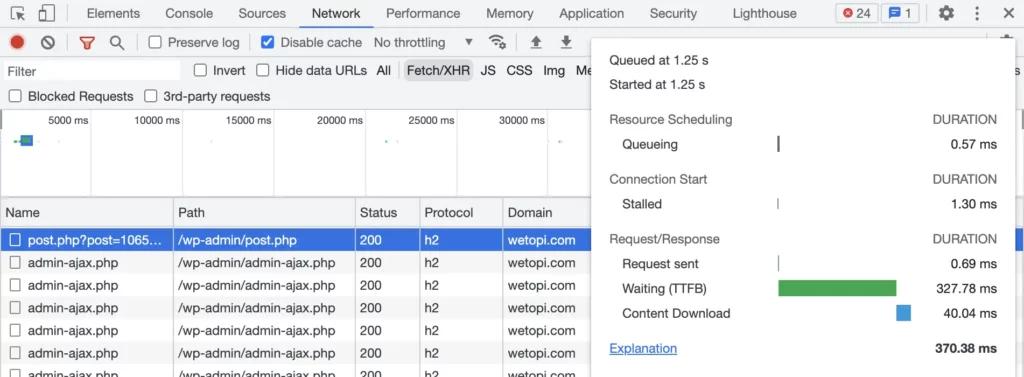
The values in these screenshots are examples from individual requests, not targets for every installation. Compare the same dashboard action under similar conditions when investigating a slow editor or administration screen.
4. Compare local tests with field data
Use PageSpeed Insights field data where available to see how real visitors experience the site. Check whether the report covers the URL or the wider origin. Local results can differ because of geography, devices, connection setup and caching. Our comparison of website performance tools covers additional diagnostic options.
How to improve TTFB in WordPress
- Reduce unnecessary redirects. Avoid sending visitors through several URL changes before they reach the final page.
- Check full-page caching. For suitable public pages, verify that the cache actually serves hits. Keep personalized pages, carts and checkout flows appropriately excluded.
- Review CDN behavior. Caching images at the edge is not the same as caching the HTML response. Check what your configuration caches and how it treats logged-in visitors.
- Investigate expensive application work. Identify slow queries, blocking external requests and plugin or theme operations before removing components or changing infrastructure.
- Review server capacity and configuration. Ask your host to investigate resource limits and request queues when measurements point to a server bottleneck. A higher CPU clock speed alone does not guarantee a fix.
For dynamic pages that cannot use public full-page caching, focus on the work needed to generate each response. Appropriate object caching and efficient queries may help, but test their effect rather than assuming that every cache setting improves every page.
Common testing mistakes
Avoid comparing a cached public page with a logged-in dashboard request, or a nearby test location with a distant one. Keep conditions consistent when evaluating a change, then test additional locations that represent your audience.
Disabling the browser cache does not necessarily bypass your server or CDN cache. Inspect the relevant cache headers and configuration before labeling a result as cached or uncached. Browser-side script reduction can improve rendering or responsiveness without directly reducing the initial HTML response time.
Make a backup before significant changes, test them on staging where possible and check essential website functions afterwards. Continue monitoring through your WordPress maintenance routine so you can detect regressions.
Choose improvements based on the bottleneck
Use TTFB to narrow down the investigation, then assess the complete loading experience. Keep the changes that measurably improve the affected requests without breaking caching rules or application behavior.
Managed hosting providers such as Wetopi, which specializes in WordPress, can help investigate server configuration and performance. The right next step still depends on the measurements for your website.