Fundamental web metrics in Google Analytics 4

Google Analytics is one of the most complete tools to collect and visualize data from a website or application. This is key for any digital business. As they say, “What cannot be measured cannot be improved.”
In addition, it is a free tool. And that’s why it is the most used by digital professionals today. Although there are other alternatives.
However, due to the enormous amount of data it collects, it can also be complex to interpret.
Since Google Analytics Universal will disappear, let’s focus on Google Analytics 4.
In this post we are going to break down some of the most important metrics that you should take into account on your website and how to find them in GA4.
Tabla de contenidos
Users
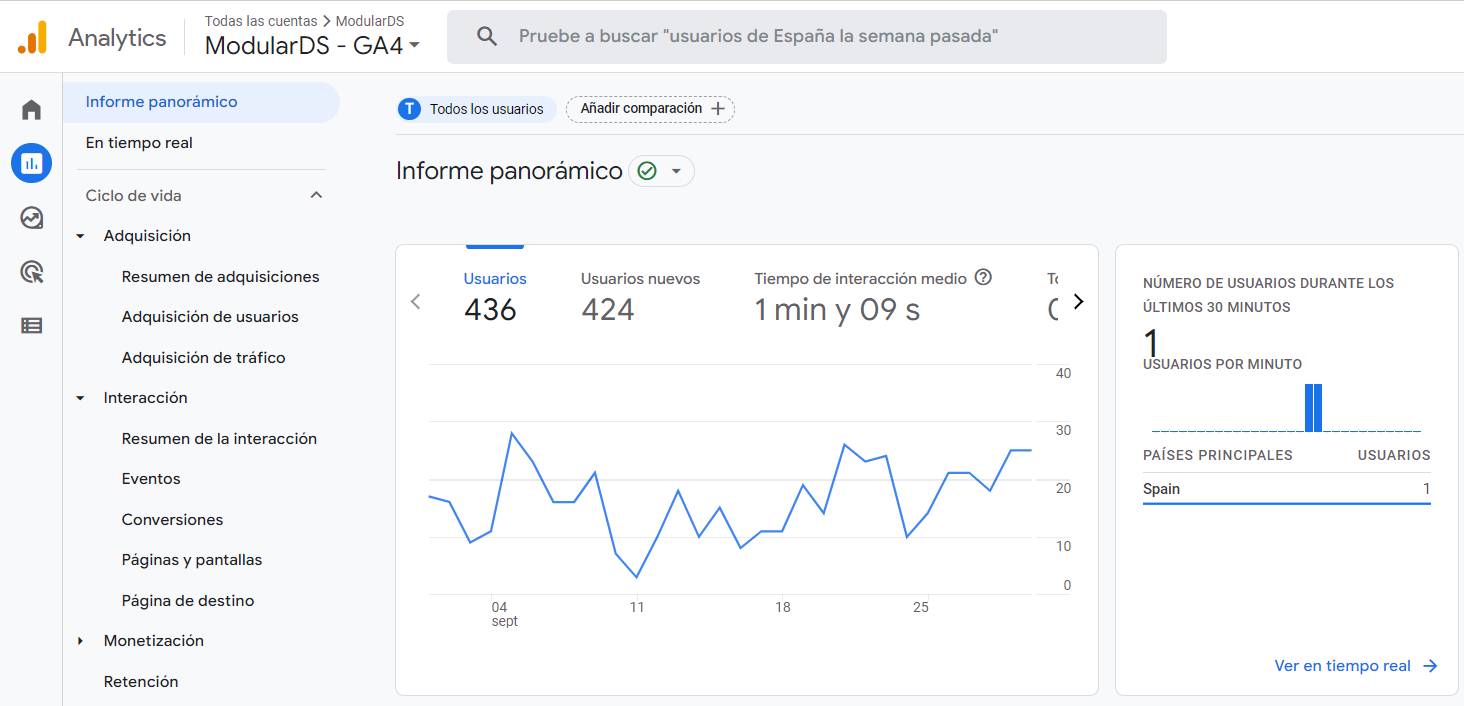
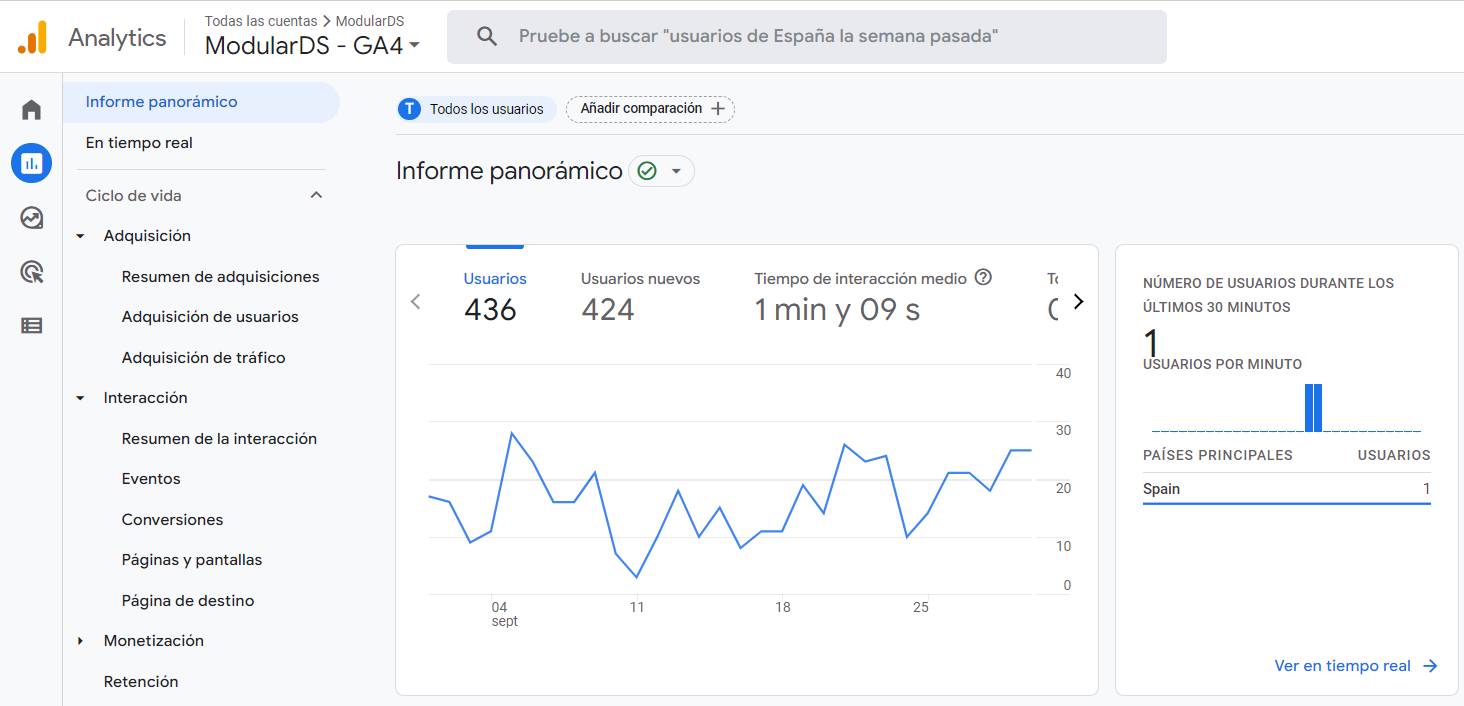
This data is the first that you will be able to observe once you log in to Google Analytics 4. This metric shows you how many users have visited your website recently. Whether they are new or recurring.
New users are visitors who have never visited your site, and returning users are visitors who have done so before.
One of the differences we found with respect to the Universal version is that Google now grants a label to each user. So when this one accesses from different devices, it will only count as a unique visitor.
We can also customize the time period we want to analyze. From 7 days to 90, even customize it to be able to extend it even more. In this way we will see the traffic that our website has had in different periods.
Meetings
A session starts when a user enters your website and ends after 30 minutes of inactivity or basically if the user enters the site through one campaign, leaves and returns through another.
Obviously, the sessions are different from the users since a user can execute numerous sessions.
Imagine that a user accesses your website through a LinkedIn post, leaves but then accesses again through a Google Ads campaign. They are two completely different sessions, even if it is the same user.
It is a very important metric because it allows you to understand how users interact with each of the sections of the website. With this information, they can make decisions to improve the user experience and increase engagement and conversion.
Percentage of new sessions
This metric is very important if you want to know the rate of new visitors versus those who are returning.
This way you can see if you are being able to retain your audience. Because if 90% are new visitors and no one comes back to your website, it’s not good news.
You have to try to find a balance between having recurring visitors that show that you are being able to build their loyalty and also getting new users who are finding you and therefore getting to know your business or company.
Acquisition of traffic
One of the most relevant statistics offered by Google Analytics is the acquisition of traffic, with which we can analyze the channel through which different users access our website.
This will help you to understand whether your marketing campaigns are working or not.
If your goal is to know the origin of the audience of your website, you just have to access the “Acquisition” tab.
With this table you will be able to know the main channels through which your users access your website.
If you have doubts about what each of them means, we’ll tell you!
- Organic Search (Organic Search): Refers to the visits that come from the Google search engine. For example, if you work with blog articles with certain keywords related to your business.
- Paid Search: This refers to the visits coming from the Google paid search. For example, from Google Ads ads.
- Social: Refers to the traffic coming from Social Networks (natural traffic without considering the paid traffic in Social Ads). In addition, if you click on this channel, you will be able to analyze the different visits broken down by social network.
- Display: Includes both Google banners and ads on Social Networks (what we call Social Ads), as long as they include the utm_medium=display.
- Referral: In this case, all external links that come to our website are included, either from communication doctors, blogs or client or partner websites.
- Email: The visits that come through CTAS in emailing are counted, as long as the utm_medium=email is incorporated.
- Direct (Direct Traffic): Refers to direct traffic, those visits that arrive when a user accesses by putting the URL in the search engine, but also through bookmarks, links in emails, links in documents (pdf, doc), traffic from mobile apps and visits from messaging systems, such as Whatsapp, Telegram or Messenger.
Time per session
This metric allows you to know how much time users spend on your website on average.
The higher the better, since that will mean that the user is interested in what you are showing him.
Be careful if the average session time is very low. Maybe they are not interested in your content, they are entering because you rank for keywords that have nothing to do with what you do or it is simply very complicated to interact with your website because the user experience is bad.
It is important to analyze it continuously and look for ways to improve.
Total views
It’s a very simple metric. In Google Analytics 4, “total views” refers to the total number of times a website or a specific page has been viewed by users.
This includes repeated views by the same user and can be an indicator of popularity and interest in a particular site or page.
The number of total views is used to measure the activity on a website and provide an overview of its performance.
The drawback of this parameter is that it does not track unique views, so this means that if a user logs in and out of your website, for example, 40 times, it will show those 40 visits.
Views per page
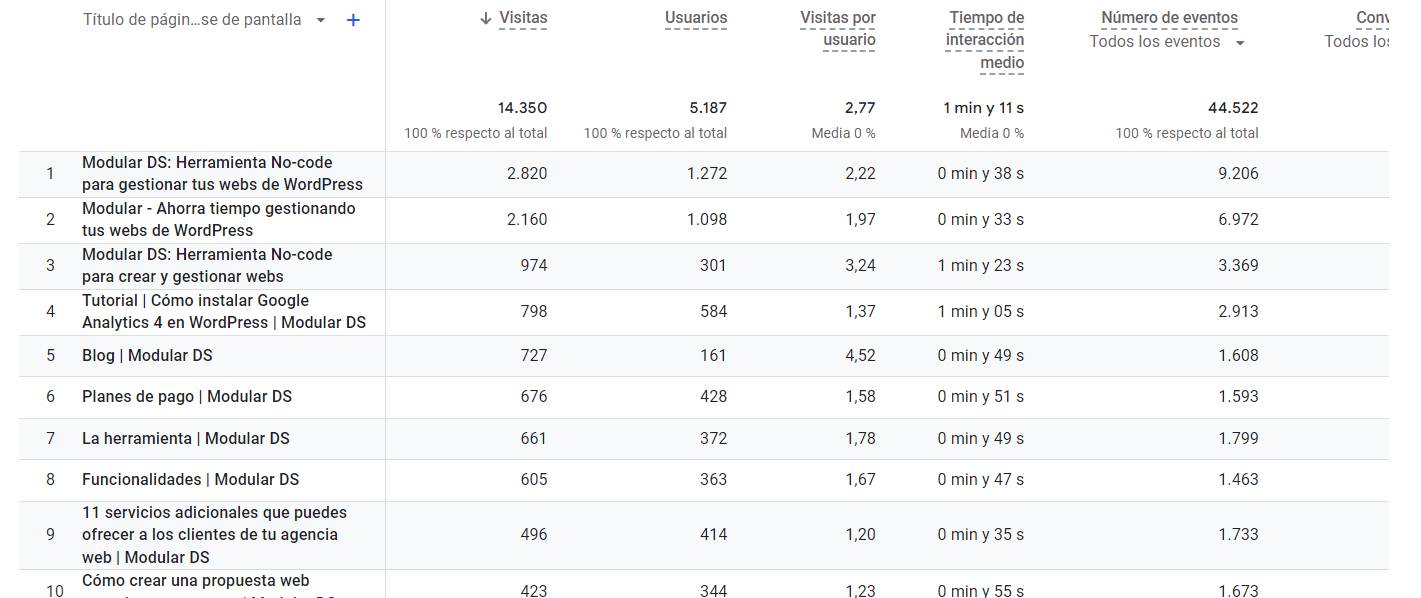
This metric allows us to know which pages of your website are viewing them.
Usually the ones that will have the most traffic will be the home page and some of the content pages, such as blog articles.
This data will allow you to obtain information about whether your marketing and SEO strategies are optimal.
Exit pages
This metric is the opposite of the previous one. Indicates which are the pages on which the user leaves the website.
Obviously something is happening if there is a specific page on which a lot of bounces are made.
Beyond seeing Google Analytics 4 as a spy that overwhelms us, we must take it into account as a savior that allows us to make the best decisions and discover problems that take a toll on our business.
Events
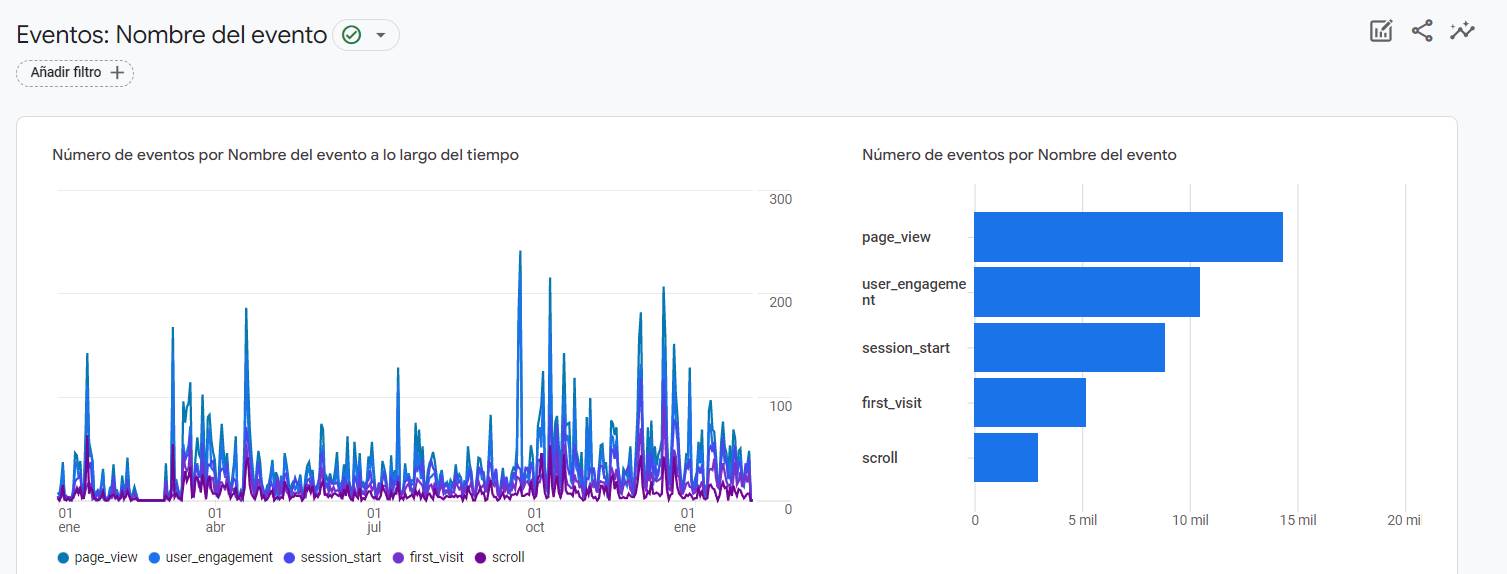
With the arrival of Google Analytics 4, the Google team has incorporated a new data model. This new version focuses mainly on events, which have to be configured in advance in order to analyze the different user behaviors on your website. Now all actions are considered events.
In Google Analytics Universal it was the opposite, since events had actions associated with them. For example, in GA4 it is advisable to create an event called “download button”, in this way, it will be activated every time a user clicks on any button that entails some download.
That count will tell you the number of times users triggered a certain event.
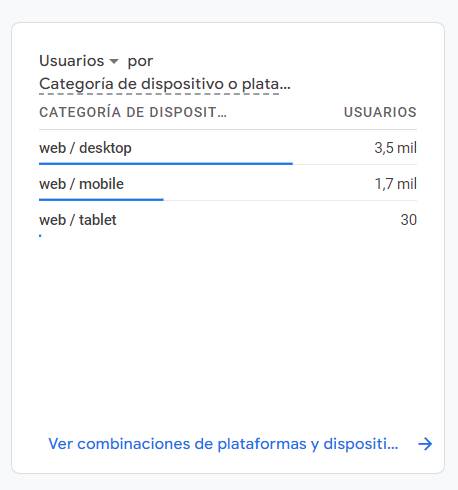
Users by device
With this data, Google Analytics allows you to know which is the source device through which the majority of users connect to your website.
Computers, tablets, mobiles.. Important when it comes to proposing your designs, for example.
Demographic and geographical data and user interests
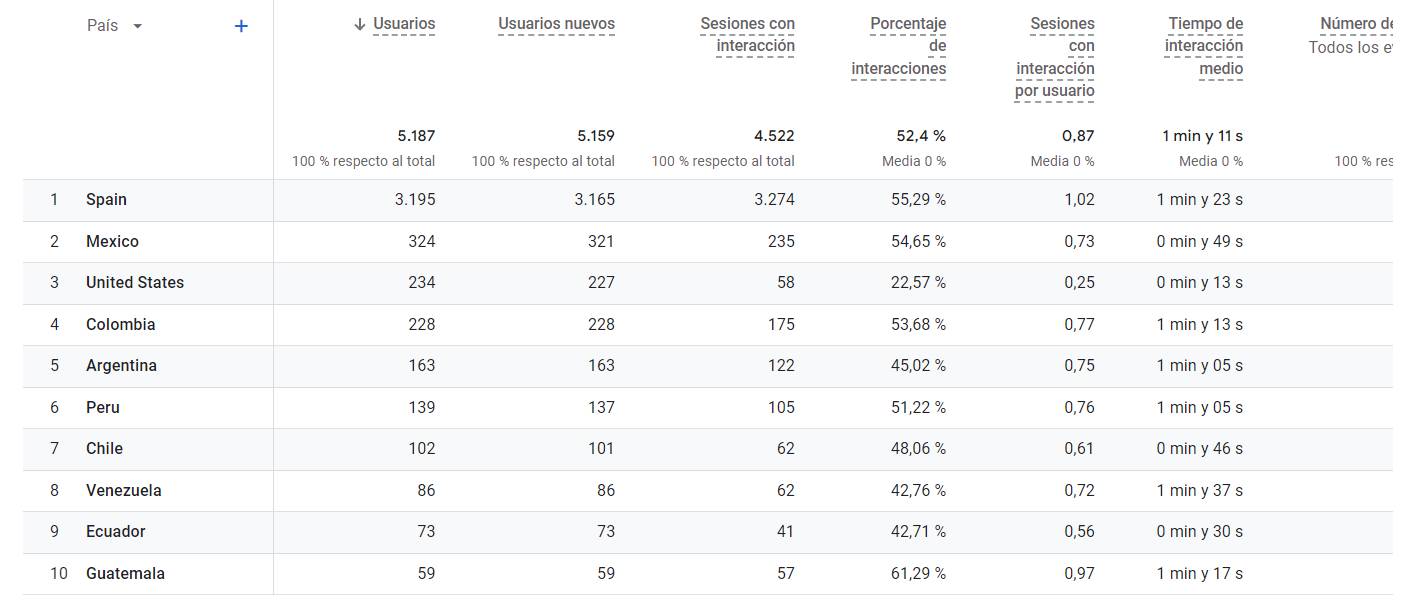
If you want to know the user’s profile, Google Analytics provides you with the “Audience” report, in which you can find:
- Demographic data: We can get to know the user in depth in terms of age and gender. In this way, if we carry out a data crosstalk we can identify very relevant insights regarding the behavior of our target audience.
- Interests: Here we can analyze the affinity of the users who access our website. In this way, we will know if the visits our site receives are aligned with our business interests.
- Geographical data: With this data we identify the language that users use when browsing as well as the location from which they access the site. Very useful for your marketing campaigns.
Search queries
Depending on the version of Google Analytics you are using (remember that in July 2023 they will remove the Universal One), you will be able to see the keywords that make visitors arrive at your website from search engines.
Another alternative to analyze what those keywords are is to use Google Search Console.
Conversions
The Google Analytics 4 conversion metric shows the number of times a user triggered a valuable event for your business on the website.
They are essential data to achieve your goals, whether they are selling or generating subscriptions or downloads.
It is important to know that this parameter not only shows the level of user participation, but also indicates the ease of use of the website, the effectiveness of marketing campaigns and the trend in user behavior.
Conclusion
Now that you know the most important metrics of Google Analytics 4, you just have to start analyzing them regularly to identify possible problems on your website or implement improvements that allow you to take your business to the next level.
If you have any doubts about installing it on your website, do not hesitate to see our guide to connect Google Analytics 4 on your WordPress page.


